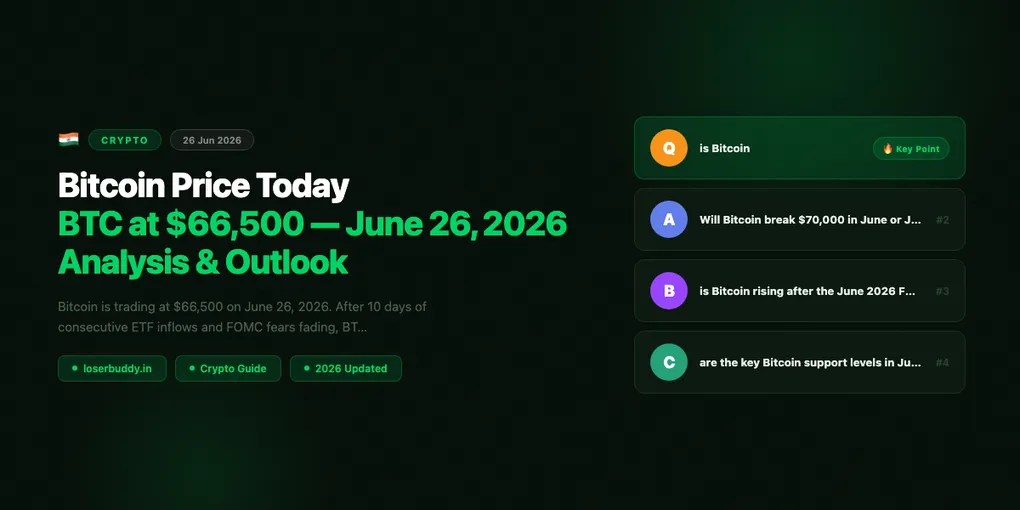
Bitcoin Price Today: BTC at $66,500 — June 26, 2026 Analysis & Outlook
Bitcoin is trading at $66,500 on June 26, 2026 — holding above the critical $65,000 support zone for the 12th consecutive day. After the Federal Reserve held rates steady at the June 17 FOMC meeting and Fed Chair Kevin Warsh’s press conference delivered fewer hawkish surprises than the market feared, crypto has staged a quiet but meaningful recovery that is now building momentum.
The Fear & Greed Index has rebounded from Extreme Fear (22) to Neutral (54) in just nine days, Bitcoin ETF inflows have run for 10 consecutive sessions, and long-term holders absorbed 125,000 BTC in June alone. The setup heading into the final week of June is quietly bullish.
Table of Contents
- Bitcoin Price Summary: June 26, 2026
- Key Technical Levels
- Bitcoin ETF Flows: 10-Day Streak
- Long-Term Holder Accumulation
- Market Sentiment Shift
- Bitcoin Outlook: July 2026 Scenarios
- What to Watch This Week
Bitcoin Price Summary: June 26, 2026
| Metric | Value |
|---|---|
| BTC Price | $66,500 |
| 24h Change | +1.2% |
| 7-Day Change | +2.8% |
| Market Cap | $1.31 trillion |
| 24h Volume | $28.4 billion |
| Fear & Greed Index | 54 (Neutral) |
Bitcoin’s recovery from the June 17 FOMC low of $63,800 has been methodical and supported by genuine buying across multiple fronts: spot ETF inflows, long-term holder accumulation, and retail sentiment recovering from Extreme Fear to Neutral. This is exactly the pattern that historically precedes larger up-moves.
Key Technical Levels
Resistance Zones
- $67,000 — Psychological round number; short-term traders may take profits here
- $68,500 — The critical 50-day moving average. BTC must close above this with volume to confirm the next leg
- $70,000 — Major resistance with two failed breakout attempts in Q2 2026; significant supply zone
- $72,500 — Next technical target if $70K breaks cleanly
Support Zones
- $65,000 — Held for 12 consecutive days; key short-term floor
- $63,200 — Prior consolidation zone from early June; strong demand expected
- $61,000 — Last major demand zone with significant order depth; a close below is structurally bearish
- $58,000 — April 2026 swing low; destination if $61K fails
Technical Indicators
The daily RSI sits at 52 — neutral, neither overbought nor oversold. Healthy recovery territory. The MACD is on the verge of printing a bullish cross on the daily chart for the first time since May 28, 2026 — a signal that has historically produced 5–15% near-term BTC rallies.
Volume profile analysis shows a massive volume node between $63,000–$67,000 — this area is acting as a strong base of support and should absorb further selling.
Bitcoin ETF Flows: 10-Day Streak
After 13 consecutive sessions of outflows that drained $4.4 billion from the market in May–June, institutional buyers returned sharply following the FOMC relief. The last 10 trading sessions have recorded uninterrupted net positive inflows into US spot Bitcoin ETFs.
| Date | Net Inflow | Leader |
|---|---|---|
| June 13 | $85.8M | BlackRock IBIT |
| June 16 | $102M | Fidelity FBTC |
| June 17 | $145M | BlackRock IBIT |
| June 18 | $178M | Multiple |
| June 19 | $195M | BlackRock IBIT |
| June 20 | $168M | Fidelity FBTC |
| June 23 | $142M | Multiple |
| June 24 | $195M | BlackRock IBIT |
| June 25 | $187M | Multiple |
Total: ~$1.4 billion in 10 sessions. This is not panic buying — it is systematic, consistent institutional accumulation during a period of retail fear. Smart money buys during Extreme Fear, not at market tops.
Track live ETF flow data at Farside Investors.
Long-Term Holder Accumulation
On-chain data shows Bitcoin long-term holders — wallets holding for 155+ days — reached a 2026 balance high of 14.8 million BTC as of June 24. They absorbed 125,000 BTC in June alone, one of the largest monthly accumulation events of the current cycle.
This pattern is deeply significant. When LTH balances rise while price is flat or declining, it means conviction holders are absorbing selling from short-term traders. This is precisely what occurred at:
- November 2020 ($14,000 BTC) → Next 18 months: $69,000
- June 2021 ($32,000 BTC) → Next 5 months: $69,000
- January 2023 ($16,500 BTC) → Next 15 months: $73,000
The current accumulation at $63,000–$67,000 fits this pattern structurally.
Market Sentiment Shift
The Crypto Fear & Greed Index moved from 22 (Extreme Fear) on June 17 to 54 (Neutral) on June 26. That’s the fastest sentiment recovery since January 2023.
Historical playbook for this pattern:
- January 2023 — Fear 21 → Neutral → BTC recovered to $31,000 within 6 weeks
- September 2023 — Fear 18 → Neutral → BTC reached $35,000 within 8 weeks
The move from Extreme Fear to Neutral is not the time to sell. Historically, this transition with rising ETF inflows and LTH accumulation signals the early innings of larger rallies, not the top.
Bitcoin Outlook: July 2026 Scenarios
Scenario 1: Bullish Breakout (45% probability)
BTC closes above $68,500 with $30B+ daily volume. Next targets: $70,000, then $72,500–$75,000. Triggered by continued ETF inflows, risk-on macro conditions, and declining BTC dominance (altcoin rotation beginning).
Scenario 2: Range Consolidation (40% probability)
BTC trades between $63,000–$70,000 through July 2026. Healthy digestion of the $108K Q1 ATH. Sets up a stronger base for Q3/Q4 moves. Not bearish — just patient.
Scenario 3: Deeper Correction (15% probability)
A macro shock (PCE inflation spike, geopolitical event, hawkish Fed surprise) pushes BTC below $61,000. Targets: $58,000 then $54,000. Represents a genuine long-term buying opportunity if it occurs.
What to Watch This Week
- PCE Inflation data (Friday, June 28) — The Fed’s preferred inflation gauge. Lower-than-expected = bullish; higher = bearish
- Daily Bitcoin ETF flow streak — Any reversal of the 10-day streak is an early warning sign
- $68,500 resistance — The make-or-break technical level for the near-term trend
- BTC dominance — Falling below 52% signals altcoin season beginning
- Fear & Greed above 60 — Any reading entering Greed territory confirms full sentiment recovery
Conclusion
Bitcoin at $66,500 on June 26, 2026 sits in a constructive recovery phase. The convergence of 10 consecutive ETF inflow days, aggressive long-term holder accumulation, sentiment recovery from Extreme Fear, and an improving technical chart all support a bullish medium-term outlook. The critical test is $68,500 — a clean close above unlocks the path to $70,000 and beyond. Manage risk, watch the levels, and let the market confirm before overcommitting.
Browse all crypto market analysis on Loser Buddy for daily updates.
Advertisement
Frequently Asked Questions
Bitcoin is trading at approximately $66,500 on June 26, 2026, recovering steadily from the FOMC-driven dip to $63,800 and supported by 10 consecutive days of ETF net inflows totaling over $1.4 billion.
Bitcoin needs to close above $68,500 (the 50-day moving average) on strong volume to signal a move toward $70,000. The current ETF inflow trend and long-term holder accumulation support a bullish case, but a clean break with volume confirmation is required.
The Fed held rates at 3.50–3.75% as expected and Fed Chair Kevin Warsh's tone was less hawkish than feared. The relief rally, combined with continuous ETF inflows and long-term holder accumulation, pushed BTC up from the $65,000 support zone.
Key BTC support: $65,000 (immediate floor), $63,200 (prior consolidation), and $61,000 (major demand zone). A daily close below $61,000 would signal a deeper correction toward $56,000–$58,000.
Spot Bitcoin ETFs are recording average daily net inflows of $120–195 million in June 2026, led by BlackRock's IBIT and Fidelity's FBTC. Total ETF AUM reached $42.7 billion as of June 24.
Advertisement